Over The Top (OTT) Switching Habits Of SPORTS FANS
Sports Innovation Lab’s Over The Top (OTT) Switching Habits Of Sports Fans
Details
Sports Innovation Lab is a fan intelligence and market research company that helps the world's leading sports organizations acquire and maximize fan revenue. Our tools analyze the fan spending habits across all major teams, leagues, and sports, and reveal consumer insights that drive acquisition and strategic decision making.
Applying our proprietary data model, we take our transactional database of 20 million anonymized individual credit & debit cardholders to track their sports fandom and customer journey across all of their Over The Top (OTT) video streaming subscriptions. Specifically, this listing surfaces data on sports fans in the following communities and across all of the specific platforms listed:
Which streaming platform is gaining or losing customers, and from which of their competitors are customers coming from or going to?
What months are customers switching the most frequently?
What community of sports fans am I winning or losing the most customers from?
How does sports seasonality drive subscribers to and from my platform and my competitors across fan communities?
Win, Loss, and Switching Analysis
Churn within any industry is incredibly valuable to understand. While most organizations know when their customers begin or end with their products & services, they might not know where they are going in terms of competition. As we track customer journeys among the general population and sports fans, our data provides a view into when, how often, and to whom customers are switching between.
In our data, companies are credited with “wins” as customers are onboarded, either new or from a competitor. These same companies are credited with “losses” when these customers leave, either exiting the industry entirely or going to a competitor. We define the latter as Switching Analysis, where we track retention and churn within groups of companies.
Switching is especially relevant for subscription companies. Among subscription companies, trials are an important part of their acquisition strategy. Taking that into account, we only consider someone to be a subscriber after being a customer for six (6) months, giving our data a lag time in results as we want to be confident in who a true subscriber really is.
After a subscriber is properly identified, they might show signs of switching between competitors. When this happens, we retroactively apply the loss metrics when there is a transition window of three (3) months in the transaction log following at least 6 months of activity towards a specific company.
For example:
Person A makes their first ever streaming sign-up in January 2021 and chooses fuboTV.
The same person signed up for Sling TV in November 2021. They still have fuboTV during this. Switching is potentially going to happen based on this decision.
Person A unsubscribes from fuboTV in January 2022, because this is within a 3 month window of the Sling TV purchase, this is considered a switch for Sling TV.
They’ve enjoyed Sling TV and no longer need their fuboTV subscription.
Person A unsubscribes from Sling TV in May 2022, therefore is no longer considered a video streamer.
The customer journey breakdown would look as such on a step-by-step basis

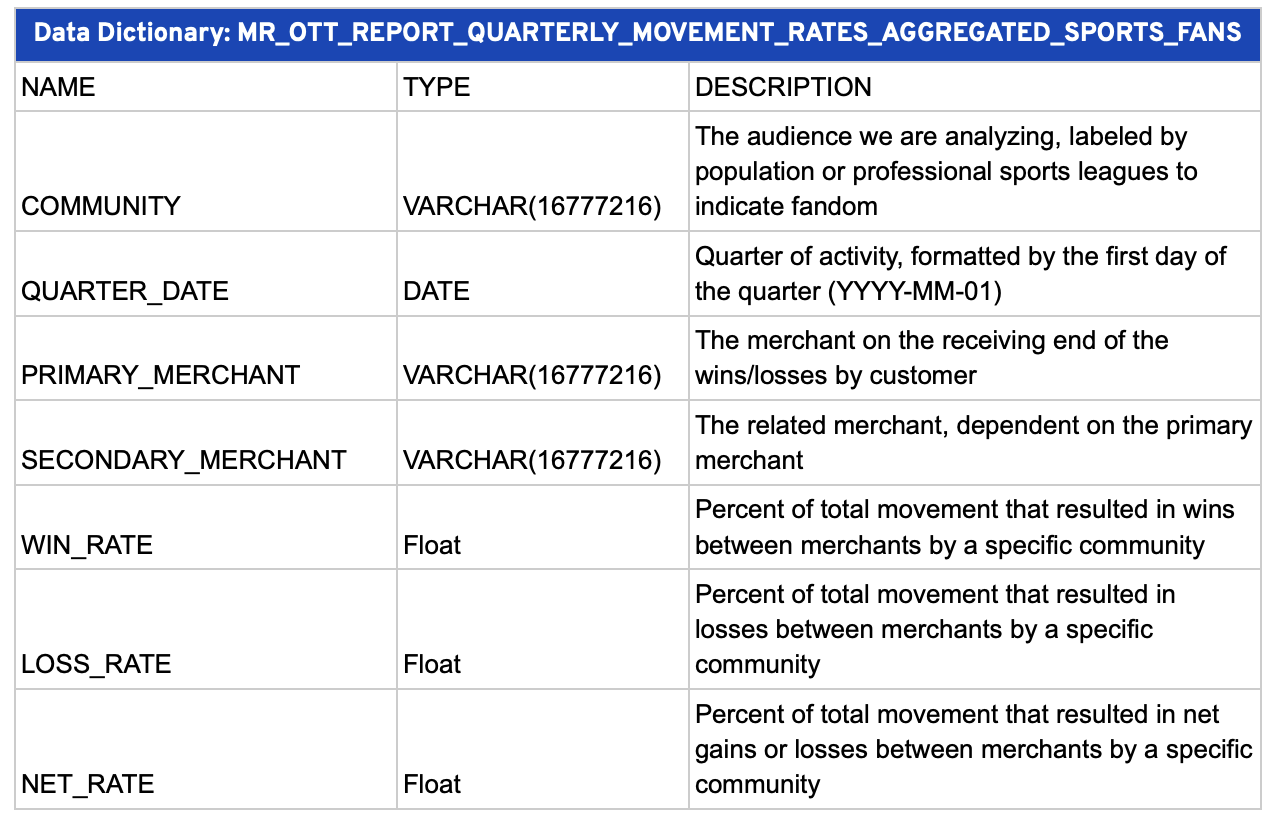
Data Dictionaries